Close overhead shot of a multi-tab Excel dashboard on a wide monitor, showing P&L variance analysis with emerald and navy bar charts, KPI summary cells, and formula bar visible, bright studio lighting, sharp focus on the data grid
— Finance Tools Library

Templates built for real finance operations

Ready-to-deploy Excel templates, dashboards, and reconciliation tools organized by finance function. Built from actual CFO workflows, not consultant decks.

Tight overhead shot of an Excel financial modeling worksheet showing DCF valuation rows, color-coded input cells in navy and emerald, clean numeric grid under bright daylight, sharp focus on formula structure
Close-up of an Excel management reporting pack open on a monitor, showing monthly actuals vs budget table with conditional formatting in emerald, clean column headers, natural window light from the left
Overhead detail shot of a bank reconciliation spreadsheet with transaction matching columns, status flags in green and red, structured row layout on a clean white desk under studio lighting
Wide-angle shot of dual monitors displaying an Excel KPI dashboard with revenue trend line charts, rolling forecast panels, and metric tiles in navy and emerald, bright office environment, sharp data readability
/ Organized by function

Four categories. Every tool has a job.

Each template ships with documentation and is structured for immediate deployment in enterprise reporting environments.

Financial Modeling
Reporting
Reconciliation
Dashboards

Valuation and scenario models

Month-end and board reporting packs

Close process and reconciliation tools

KPI and forecasting dashboards

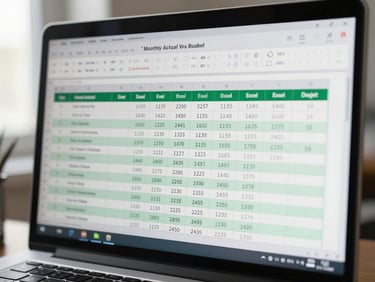
Automated actuals-vs-budget packs, variance commentary templates, and executive summary layouts for monthly close.

Bank rec, intercompany elimination, and balance sheet sign-off tools built to compress the monthly close cycle.

Rolling forecast, KPI tracker, and FP&A performance dashboards wired for dynamic data and executive-ready output.

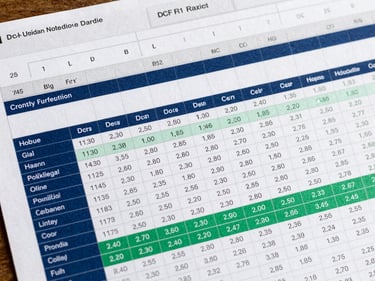
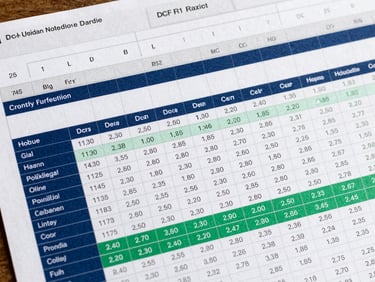
DCF, three-statement, and scenario planning templates structured for CFO review and board presentation.

Premium downloads. One sign-up.

Full library access requires a newsletter subscription. Join finance professionals who use E4Excel as their primary resource for automation and analytics work.